

Model comparison
Honda Odyssey vs Toyota Sienna
Depreciation, used prices, ownership costs and model-year data compared
See the comparisonThe Honda Odyssey loses about 35.1% of its original value over its first five years, making it a solid value retainer. Skip the new-car premium: a 2019 runs about $16,540 below its original MSRP.
Compare With
Open a side-by-side comparison of five-year value retention, depreciation by model year, used asking prices, repair costs, MPG and safety data.
Model comparison
Depreciation, used prices, ownership costs and model-year data compared
See the comparison
Model comparison
Depreciation, used prices, ownership costs and model-year data compared
See the comparison
Model comparison
Depreciation, used prices, ownership costs and model-year data compared
See the comparisonAt a glance
After 1 year
7.1%
typical loss
After 3 years
22.4%
typical loss
After 5 years
35.1%
typical loss
Biggest drop
2020→2019
+8.5% in one year
Smart-buy year
2019
~$23,170 median
CPO premium
+$4,600
vs. non-certified
Accident-reported
36.6%
of listings
| Model year | Depreciation from MSRP |
|---|---|
| 2026 | 7.1% |
| 2025 | 9.7% |
| 2024 | 15.8% |
| 2023 | 21.2% |
| 2022 | 25.4% |
| 2021 | 27.9% |
| 2020 | 34.8% |
| 2019 | 43.3% |
| 2018 | 49.4% |
| 2017 | 55.6% |
| 2016 | 61.9% |
| 2015 | 66.5% |
Based on 2,260 real used-car listings. Each listing's price is adjusted to a standard 12,000 mi/year for its age and compared to the vehicle's original MSRP; figures reflect a 5% asking-to-sale estimate.
Estimated value of a typical Honda Odyssey as it ages, from a ~$43,895 new price.
| Age | Retained | Est. value | Lost that year | Total lost |
|---|---|---|---|---|
| 1 yr | 93% | $40,783 | −$3,112 | −$3,112 |
| 2 yrs | 85% | $37,283 | −$3,500 | −$6,612 |
| 3 yrs | 78% | $34,084 | −$3,199 | −$9,811 |
| 4 yrs | 71% | $31,159 | −$2,925 | −$12,736 |
| 5 yrs | 65% | $28,485 | −$2,674 | −$15,410 |
| 6 yrs | 59% | $26,040 | −$2,445 | −$17,855 |
| 7 yrs | 54% | $23,806 | −$2,234 | −$20,089 |
| 8 yrs | 50% | $21,763 | −$2,043 | −$22,132 |
Interactive tool
Estimate a used Odyssey's value from its year and mileage, using our depreciation model.
$23,800
about typical mileage
At 84,000 miles (about typical for a 7-year-old car, ~84,000 mi). Estimate only — actual value depends on condition, trim, options, and local demand.
Cost of ownership
The two biggest costs — depreciation and fuel — over five years for a recent model bought new (~$43,895).
Fuel cost from the EPA. Maintenance, insurance, taxes, and financing are additional and vary by driver and location.
If you're shopping for a Honda Odyssey, it's a strong long-term value that's easy to resell. The smartest pick is a 2019 (around $23,170) — it sits just past the steepest depreciation, so the first owner already absorbed the biggest loss. Favor the Sport-L trim for the best resale, and always pull a vehicle-history report before buying.
The steepest single-year drop happens between the 2020 and 2019 model years, when depreciation jumps 8.5% points. That makes the 2019 Odyssey a value sweet spot — the previous owner absorbs the worst of the drop, and you still get a relatively recent car.
Trim matters: the Sport-L holds its value best (about 9.1% average depreciation), while the Touring Elite gives up the most (around 66.4%). Choosing the right trim can be worth thousands at resale.
Across 2,921 listings in 43 states, 36.6% of listed examples report a prior accident, 52.5% are one-owner cars, averaging 1.6 owners. Certified pre-owned Odysseys command roughly a $4,600 premium over comparable non-certified cars.
Share of original MSRP retained, averaged across model years.
Median asking price by state (with its share of original MSRP) — a lower share means a better deal for buyers.
Across 2,921 Honda Odyssey listings.
Accident-free
63.4%
One-owner
52.5%
Avg owners
1.6
Personal use
76.7%
Certified (CPO)
0.3%
CPO premium
+$4,600
Mileage profile across 2,921 listings.
Over 100k mi
31.7%
Over 150k mi
7.4%
Highest mileage
270,120 mi
Price at 120k+ mi
$14,657
Roughly 31.7% of listed Honda Odysseys have already crossed 100,000 miles, and 7.4% are past 150,000 — a sign these go the distance with maintenance.
The 2019 Honda Odyssey sits just past the steepest depreciation drop, with a typical asking price around $23,170 — about $16,540 off its original MSRP.
View 2019 details →| Year | Depreciation | MSRP | Median Price | Listings |
|---|---|---|---|---|
| 2026 | 7.1% | $43,895 | $44,026 | 200 |
| 2025 | 9.7% | $43,370 | $37,205 | 199 |
| 2024 | 15.8% | $42,260 | $36,316 | 200 |
| 2023 | 21.2% | $41,360 | $34,493 | 198 |
| 2022 | 25.4% | $43,750 | $30,402 | 200 |
| 2021 | 27.9% | $38,460 | $28,134 | 200 |
| 2020 | 34.8% | $37,960 | $25,436 | 194 |
| 2019 | 43.3% | $39,710 | $23,170 | 199 |
| 2018 | 49.4% | $37,360 | $20,500 | 199 |
| 2017 | 55.6% | $36,500 | $16,195 | 120 |
| 2016 | 61.9% | $38,050 | $14,386 | 176 |
| 2015 | 66.5% | $37,375 | $12,395 | 175 |
A sample of real listings behind the figures above.

$50,184
2026 Touring · White
2 mi · Hickory, NC
View listing →

$46,590
2024 Elite · Gray
5,688 mi · Cleveland, OH
View listing →
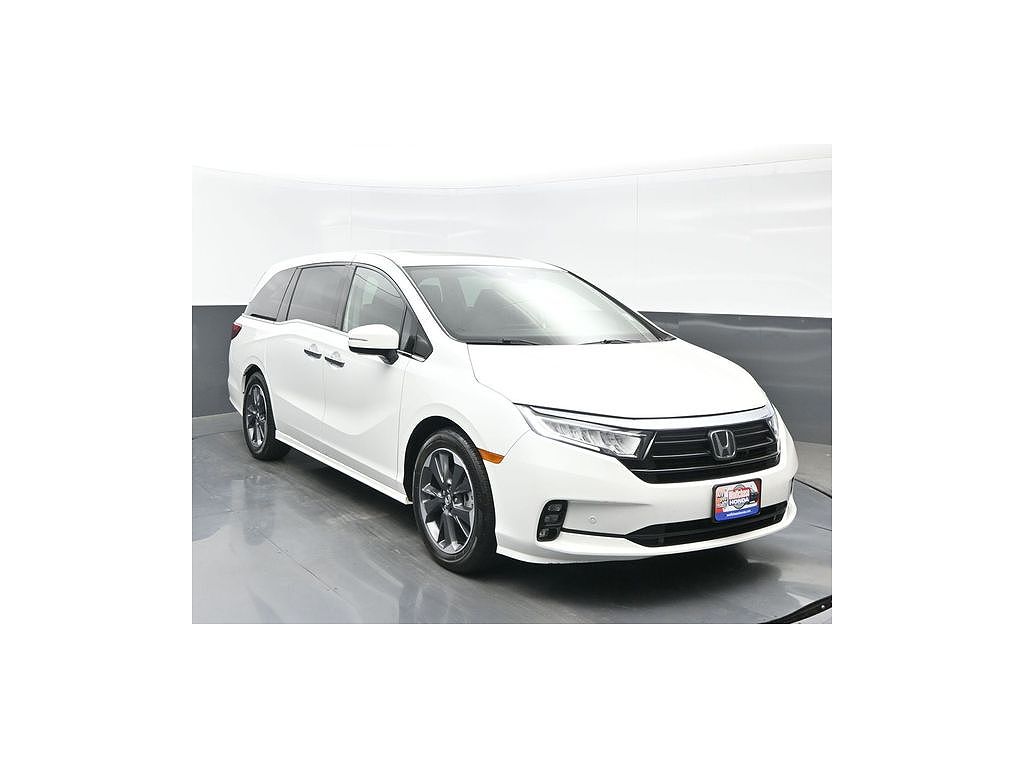
$40,849
2022 Elite · White
29,540 mi · Bartlett, TN
View listing →

$37,590
2019 Elite · Gray
20,962 mi · Indianapolis, IN
View listing →
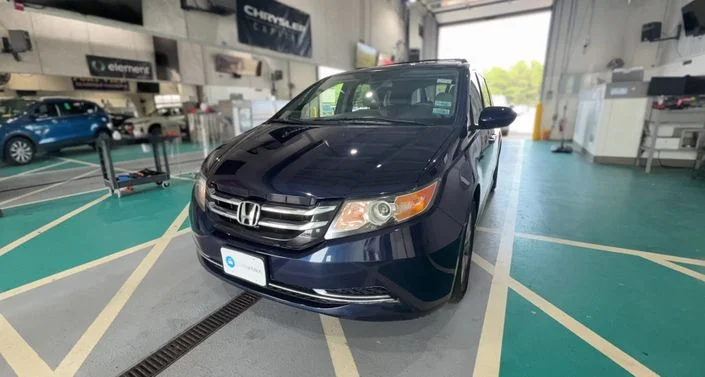
$15,996
2017 EX-L · Blue
91,276 mi · Patchogue, NY
View listing →

$25,590
2015 EX-L · Gray
61,152 mi · Sacramento, CA
View listing →
Live dealer listings, refreshed periodically. Prices and availability change.
A Honda Odyssey loses about 35.1% of its original value over five years, based on a mileage-adjusted analysis of real used-car listings. The drop is gradual at first — about 7.1% after one year and 22.4% after three — then keeps compounding with age and mileage. For example, a 2021 Odyssey that cost about $38,460 new listed for roughly $28,134 in the analyzed cohort. Your exact figure depends on trim, mileage, condition, and local demand, but the five-year mark is where most of the early depreciation has already happened — which is what makes lightly-used examples such good value.
The 2019 Odyssey is the value sweet spot: it sits just past the model's steepest one-year depreciation drop, so the first owner has already absorbed the biggest loss. Expect to pay around $23,170 for a typical example, and the Sport-L trim will hold its value best from there. As always, a well-maintained, accident-free example with average mileage for its age is worth paying a little more for than a cheap car with a questionable history. Whatever year you settle on, budget for a pre-purchase inspection — at a couple hundred dollars, it's the cheapest insurance against an expensive surprise down the road.
The Sport-L retains the most value, depreciating about 9.1% on average across model years in our data. Trim choice can swing resale by thousands of dollars over a few years, because desirable trims stay in demand on the used market while stripped-down or niche trims sell at a discount. It's also worth comparing the trim premium new versus used — a pricier trim sometimes depreciates enough to become the smarter used buy. If you expect to resell, the Sport-L is the safer bet; if you're keeping the car long-term, buy the trim with the features you actually want and worry less about resale.
Certified pre-owned Odysseys sell for roughly $4,600 more than comparable non-certified cars, and make up about 0.3% of listings. That premium buys a manufacturer-backed inspection, a reconditioning standard, and an extended warranty. A useful test is to compare the CPO price against a non-certified example plus a third-party warranty quote — sometimes that combination costs less for similar protection. As a rule, CPO is usually worth it on a newer car you plan to keep, where the warranty has real value; on an older, cheaper car the premium is harder to justify and a thorough independent inspection may serve you better.
About 36.6% of listed Odysseys report a prior accident, while 52.5% are one-owner vehicles averaging 1.6 owners. A reported accident isn't automatically disqualifying — severity matters far more than the fact of a claim. Minor cosmetic or fender-bender claims affect value much less than structural damage or airbag deployment, so read the detail in the history report rather than just the count. Either way it should be reflected in the price; always pull a full vehicle-history report, and prefer a clean, one-owner car when the price difference is small.
Depreciation is computed from 2,260 real used-car listings. Each listing's asking price is normalized to a standard 12,000 miles per year for the vehicle's age, adjusted by a 5% asking-to-sale estimate, and compared against the original base MSRP for that VIN's trim. Headline 1/3/5-year figures reflect a smoothed retention curve fitted across all model years (the typical trajectory); individual years in the table above can run above or below it with market conditions. Full methodology. Updated August 2026.