

Model comparison
Honda Accord vs Toyota Camry
77% vs 77% estimated value retained after five years
See the comparisonThe Honda Accord market is split by two clean redesigns. The 2015-2017 cars are the final ninth-generation value buys, 2018-2022 is the turbocharged tenth generation, and 2023 onward shifts the lineup toward the 11th generation and a larger hybrid role. Across 2,486 listings, our fitted curve estimates 22.6% depreciation after five years. The best choice depends less on a universal "best year" than on which generation, powertrain, and price gap you are actually comparing.
Compare With
Open a side-by-side comparison of five-year value retention, depreciation by model year, used asking prices, repair costs, MPG and safety data.
Model comparison
77% vs 77% estimated value retained after five years
See the comparison
Model comparison
77% vs 60% estimated value retained after five years
See the comparison
Model comparison
63% vs 77% estimated value retained after five years
See the comparison| Model year | Depreciation from MSRP |
|---|---|
| 2026 | 0.0% |
| 2025 | 10.1% |
| 2024 | 12.6% |
| 2023 | 17.1% |
| 2022 | 15.5% |
| 2021 | 20.4% |
| 2020 | 24.8% |
| 2019 | 29.1% |
| 2018 | 36.1% |
| 2017 | 43.3% |
| 2016 | 47.5% |
| 2015 | 53.0% |
Based on 1,839 real used-car listings. Each listing's price is adjusted to a standard 12,000 mi/year for its age and compared to the vehicle's original MSRP; figures reflect a 5% asking-to-sale estimate.
The buying decision
Our best all-around pick is the 2023 Accord. It starts the 11th generation, yet its current median ask is $478 less than the 2022 while carrying about 21,579 fewer average miles. That unusual combination gives the newer generation the edge in this snapshot. For a lower budget, the 2020 is the sharper tenth-generation buy because it is $952 more than the 2019 with about 8,681 fewer average miles.
Best under $20k
Target trim: LX
Model-year sample across all trims.
The 2015 LX is the lowest-priced Accord year in our current catalog and keeps the specification simple. It works best for buyers who value purchase price and documented maintenance more than the turbo engines, standard driver-assistance suite, and newer cabin introduced later.
Tradeoff: This is now an older-car purchase. Leave room for inspection findings and age-related service instead of using the entire budget on the advertised price.
Best 10th-gen value
Target trim: LX or Sport
Model-year sample across all trims.
The 2020 sits in the middle of the 2018-2022 generation. Its median ask is $952 more than 2019 even though the sample carries about 8,681 fewer average miles. Choose LX for the lowest spend or Sport only when its equipment and driving feel justify the actual premium.
Tradeoff: The price advantage is small enough that a cleaner 2019 or 2021 can still be the better car. Match powertrain, trim, mileage, and history before comparing prices.
Best overall
Target trim: LX or hybrid
Model-year sample across all trims.
The 2023 begins the 11th generation and currently costs $478 less than 2022 in the all-trim sample, while average mileage is roughly 21,579 miles lower. Pick the LX when entry price leads; compare same-year hybrid trims when fuel use and equipment matter more.
Tradeoff: First-year redesign inventory can vary widely by trim and prior use. Confirm the exact powertrain, original equipment, warranty start date, and recall status by VIN.
Generation context
Accord trim names repeat across generations, but the cars underneath them change. Start with the generation boundary, then compare adjacent years inside it.
2015-2017
Ninth-gen closeout
Median asking prices run from $13,989 to $15,644, with average mileage spanning 106,682 to 118,463 miles.
These are the oldest Accords represented in our current data and therefore the entry point to the model. They predate the ground-up 2018 redesign. Buy on maintenance records, collision history, and inspection quality; a one-year difference matters less than evidence that the previous owner kept up with the car.
Honda: Accord history through the ninth generation2018-2022
Tenth generation
Median asking prices run from $18,349 to $25,392, with average mileage spanning 59,717 to 99,871 miles.
Honda redesigned the Accord from the ground up for 2018 with a new chassis, turbocharged engines, a new two-motor hybrid generation, and Honda Sensing standard across trims. This era has enough price spread to reward direct comparison: our 2020 currently undercuts 2019, while 2022 carries a noticeable mileage advantage over 2021.
Honda: all-new 10th-generation 2018 Accord2023-present
Eleventh generation
Median asking prices run from $24,914 to $42,405, with average mileage spanning 6 to 38,138 miles.
The 2023 redesign introduced the 11th-generation Accord with an evolved two-motor hybrid system, newer connectivity, and updated safety technology. Gas and hybrid trims occupy different parts of this lineup, so a single model-year median can hide a large equipment and powertrain mix. Compare exact trims rather than treating the headline median as a quote.
Honda: North American 11th-generation Accord announcementSame-horizon comparison
These are five-year fitted depreciation curves from the same listing pipeline. Holding the time horizon constant gives a cleaner comparison than averaging every available model year, although it still cannot replace a VIN-level purchase comparison.
The Accord sits very close to the Camry, giving up only 0.8 percentage points more over five years. That difference is smaller than many real negotiation, condition, and financing gaps. The Altima loses 17.5 points more than the Accord in our curves, which weakens resale but can also create a lower used entry price. Buy the best transaction, not the highest-retention badge at any price.
Retains about 77.4% after five years
Retains about 76.6% after five years
Retains about 59.9% after five years
Curves use the same mileage-adjusted listing methodology. They do not control for purchase incentives, taxes, financing, insurance, or maintenance.
Trim strategy
Accord trim labels do not mean the same thing in every generation, and powertrain mix changes sharply in 2023. Compare trims within one model year before drawing a resale conclusion.
LX / EX
Use these as the baseline for price and equipment. A lower trim with cleaner history and fewer miles is usually a stronger value than a feature-heavy car carrying deferred maintenance or collision repair.
Sport
Sport equipment and powertrain availability change by generation. Confirm the year-specific specification rather than assuming one Sport listing is directly comparable with another from a different generation.
EX-L / Touring
Upper trims can be attractive after their original premium softens. Compare the actual used-price gap with the equipment you value instead of assuming every option will return its cost at resale.
Hybrid
Hybrid inventory skews newer in our sample. Compare it with same-year gas cars, then add fuel savings based on your annual driving and local prices. A blended cross-year retention number is not decision-grade evidence.
Before you commit
The generation and trim tell you what to research; the VIN and inspection tell you whether the specific car deserves your money.
Decode the VIN and review the original window sticker when available. Repeated trim names and changing gas-hybrid lineups make listing titles an unreliable specification source by themselves.
Model-year recall totals are only a starting point. Use the NHTSA or Honda VIN lookup to see whether this vehicle is included and whether the remedy has been completed.
Ask whether windshield or collision repairs required camera or sensor calibration. The goal is documented repair quality, not rejecting every car that has had ordinary work performed.
Confirm the original in-service date, remaining coverage, service records, and any diagnostic findings. Compare those facts with a same-year gas car and your expected fuel savings.
Analyst notes
The Accord dataset contains real market signals, but generation changes and trim mix can make a confident-looking average answer the wrong question.
01
Our 2026 sample averages only 6 miles and shows a $42,405 median ask against a $39,495 base MSRP. Options, destination charges, dealer pricing, and inventory classification can create that spread. It is not evidence of appreciation.
02
Sport, Touring, and hybrid listings do not have the same year distribution. Pooling them across 2015-2026 rewards whichever group is newest. Same-year, similar-mileage comparisons are the minimum defensible unit for a trim or powertrain claim.
03
NHTSA counts are useful for finding patterns to investigate, but they are not normalized for vehicles sold, time in service, or miles driven. Read the underlying issue categories and check the specific VIN rather than ranking years by count alone.
Estimated value of a typical Honda Accord as it ages, from a ~$39,495 new price. We start at age two because near-new asking prices are too noisy to treat as first-year appreciation.
| Age | Retained | Est. value | Lost that year | Total lost |
|---|---|---|---|---|
| 2 yrs | 91% | $36,002 | −$2,013 | −$3,493 |
| 3 yrs | 86% | $34,094 | −$1,908 | −$5,401 |
| 4 yrs | 82% | $32,288 | −$1,806 | −$7,207 |
| 5 yrs | 77% | $30,578 | −$1,710 | −$8,917 |
| 6 yrs | 73% | $28,958 | −$1,620 | −$10,537 |
| 7 yrs | 69% | $27,424 | −$1,534 | −$12,071 |
| 8 yrs | 66% | $25,971 | −$1,453 | −$13,524 |
Interactive tool
Estimate a used Accord's value from its year and mileage, using our depreciation model.
$34,100
about typical mileage
At 36,000 miles (about typical for a 3-year-old car, ~36,000 mi). Estimate only — actual value depends on condition, trim, options, and local demand.
Cost of ownership
The two biggest costs — depreciation and fuel — over five years for a recent model bought new (~$39,495).
Fuel cost from the EPA. Maintenance, insurance, taxes, and financing are additional and vary by driver and location.
Across 2,486 Honda Accord listings.
Accident-free
77%
One-owner
49.6%
Avg owners
1.6
Personal use
50.4%
Certified (CPO)
0.6%
CPO premium
+$1,600
Mileage profile across 2,486 listings.
Over 100k mi
27.9%
Over 150k mi
5.3%
Highest mileage
282,117 mi
Price at 120k+ mi
$13,484
Roughly 27.9% of listed Honda Accords have crossed 100,000 miles, and 5.3% are past 150,000. That shows there is an active market for high-mileage Accords; it is not a survival rate or a promise that a specific car will reach either milestone.
| Year | Depreciation | MSRP | Median Price | Listings |
|---|---|---|---|---|
| 2026 | 0.0% | $39,495 | $42,405 | 60 |
| 2025 | 10.1% | $30,560 | $27,238 | 117 |
| 2024 | 12.6% | $29,910 | $26,079 | 116 |
| 2023 | 17.1% | $29,060 | $24,914 | 107 |
| 2022 | 15.5% | $28,980 | $25,392 | 159 |
| 2021 | 20.4% | $27,230 | $22,798 | 185 |
| 2020 | 24.8% | $26,530 | $20,090 | 175 |
| 2019 | 29.1% | $26,180 | $19,138 | 175 |
| 2018 | 36.1% | $25,780 | $18,349 | 189 |
| 2017 | 43.3% | $25,215 | $15,644 | 176 |
| 2016 | 47.5% | $25,065 | $14,916 | 191 |
| 2015 | 53.0% | $25,830 | $13,989 | 189 |
A sample of real listings behind the figures above.

$43,384
2026 Touring Hybrid · Gray
2 mi · Hickory, NC
View listing →

$25,590
2024 EX · Blue
40,710 mi · Columbus, OH
View listing →

$30,990
2022 Sport · Silver
22,375 mi · Columbus, OH
View listing →

$25,990
2019 Sport · Silver
18,857 mi · Cleveland, OH
View listing →
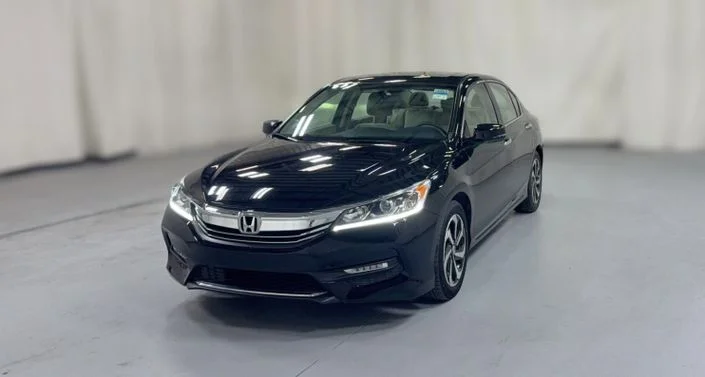
$24,990
2017 EX · Black
23,822 mi · Dallas, TX
View listing →

$23,990
2015 EX-L · White
33,660 mi · Memphis, TN
View listing →
Live dealer listings, refreshed periodically. Prices and availability change.
The 2023 Accord is our best all-around pick in this market snapshot. It begins the 11th generation, yet its median asking price is $478 less than the 2022 and its sample averages about 21,579 fewer miles. That is a compelling price-to-generation step, not a promise that every 2023 is the better car. Match the exact gas or hybrid trim, equipment, accident history, service records, and local asking price. A well-kept 2022 can still beat a poorly represented 2023, so compare several real listings and inspect the finalist before buying.
The 2015 Accord LX is the clearest starting point in our current data, with a median ask around $13,989 and average mileage near 118,463. Its appeal is straightforward purchase price, not newer-generation technology. At this age, condition dominates the model-year spreadsheet. Review maintenance history, inspect for collision repair and corrosion, scan all modules for stored faults, and keep part of the budget for near-term service. A more expensive documented car can cost less to own than the cheapest listing.
In this snapshot, the 2020 has the stronger numbers: its median ask is $952 more than the 2019 and its listings average about 8,681 fewer miles. Both belong to the same tenth generation, so the comparison is cleaner than crossing a redesign boundary. Still, the observed gap is small. Match trim, powertrain, mileage, accident history, tires, service records, and seller fees. Use the 2020 as the first search filter, then let the condition and total transaction price choose the specific car. Check whether dealer add-ons erase the modest advertised-price advantage before deciding.
The current data favors 2023: the all-trim median is $478 less than 2022 while average mileage is about 21,579 miles lower. The 2023 also starts the 11th generation, so the cars are not simply one model year apart. Compare exact trims because the gas and hybrid lineup changed, and check warranty start dates and prior use. If a like-for-like 2023 remains similarly priced after fees, it is the stronger value; a discounted, cleaner 2022 can still win on the actual deal.
The cross-year listing average cannot answer that cleanly because Accord hybrid inventory skews newer and the hybrid role expands in the 2023 generation. A lower raw depreciation percentage may be measuring age and trim mix rather than buyer preference for the powertrain. Compare gas and hybrid examples from the same year with similar original MSRP, equipment, mileage, condition, and history. Then estimate fuel savings using your annual miles and local prices, and document warranty timing. That combined ownership calculation is more useful than declaring one powertrain the universal resale winner.
27.9% of Accord listings in this dataset are above 100,000 miles, while cars at 120,000 miles or more have a median ask around $13,484. That share is partly shaped by our 2015-2026 year coverage and should not be treated as a survival rate. A high-mileage Accord can make sense with complete records, a clean structural inspection, and a price that leaves room for wear items. Ask the inspector to identify near-term work in dollars; deferred maintenance can erase the initial savings quickly.
Our mileage-adjusted fitted curve estimates about 22.6% depreciation after five years, leaving roughly 77.4% of original value. The estimate uses 2,486 current listings across multiple model years and adjusts asking prices toward an estimated sale price. It is a model-level trajectory, not a valuation for a specific VIN. Purchase price, generation, gas or hybrid powertrain, trim, mileage, condition, accident history, location, and the market when you sell can all move the result. Calculate your likely dollar loss from the price you actually negotiate.
Depreciation is computed from 1,839 real used-car listings. Each listing's asking price is normalized to a standard 12,000 miles per year for the vehicle's age, adjusted by a 5% asking-to-sale estimate, and compared against the original base MSRP for that VIN's trim. Headline 1/3/5-year figures reflect a smoothed retention curve fitted across all model years (the typical trajectory); individual years in the table above can run above or below it with market conditions. Full methodology. Updated August 2026.