

Model comparison
Honda Accord vs Toyota Camry
77% vs 77% estimated value retained after five years
See the comparisonThe Toyota Camry is not one used-car market. The 2012-2017 cars are budget transportation, the 2018-2024 cars are the modern gas-era core, and 2025 onward is a hybrid-only reset. Across 3,401 current listings, our fitted curve estimates 23.4% depreciation after five years. The useful question is not whether a Camry holds value. It is which Camry era gives you the right mix of price, mileage, safety technology, and remaining life.
Compare With
Open a side-by-side comparison of five-year value retention, depreciation by model year, used asking prices, repair costs, MPG and safety data.
Model comparison
77% vs 77% estimated value retained after five years
See the comparison
Model comparison
60% vs 77% estimated value retained after five years
See the comparison
Model comparison
77% vs 70% estimated value retained after five years
See the comparison| Model year | Depreciation from MSRP |
|---|---|
| 2026 | 0.8% |
| 2025 | 0.0% |
| 2024 | 3.1% |
| 2023 | 8.7% |
| 2022 | 13.5% |
| 2021 | 18.3% |
| 2020 | 27.4% |
| 2019 | 30.8% |
| 2018 | 35.2% |
| 2017 | 42.2% |
| 2016 | 48.3% |
| 2015 | 51.5% |
| 2014 | 59.9% |
| 2013 | 60.0% |
| 2012 | 60.5% |
Based on 2,060 real used-car listings. Each listing's price is adjusted to a standard 12,000 mi/year for its age and compared to the vehicle's original MSRP; figures reflect a 5% asking-to-sale estimate.
The buying decision
Our best all-around pick is the 2023 Camry. It is late enough in the 2018-2024 generation to include the post-2021 safety and cabin updates, but it avoids the price step into the hybrid-only redesign. In this market snapshot, it costs only $1,839 more than a 2022 while carrying about 12,121 fewer average miles. That is a more defensible value signal than simply choosing the oldest year after the largest depreciation drop.
Best under $15k
Target trim: LE
Model-year sample across all trims.
The 2015 is the budget sweet spot because it received a substantial body, cabin, and chassis redesign without moving into newer-car pricing. The LE keeps the purchase simple: prioritize maintenance records, tires, brakes, and accident history over optional equipment.
Tradeoff: Average mileage is already above 100,000, so a pre-purchase inspection matters more than finding the absolute lowest advertised price.
Best overall
Target trim: LE or SE
Model-year sample across all trims.
This is the strongest price-to-age point in our current data. The median ask is $25,855, just $1,839 more than 2022, while average mileage is about 12,121 miles lower. Choose LE for lower total spend or SE for the appearance and suspension you actually prefer.
Tradeoff: The 2022 and 2023 are close enough that condition and service history should break the tie. Do not pay a large model-year premium for the 2023 badge alone.
Best near-new
Target trim: LE
Model-year sample across all trims.
The 2025 starts the hybrid-only generation and adds available electronic all-wheel drive. In this snapshot, its median ask is only $2,468 more than the 2024, making the older gas model difficult to justify when similarly equipped cars are this close.
Tradeoff: Near-new asking prices can sit close to MSRP. Compare the used car's full out-the-door price with a new-car quote, financing incentives, warranty start date, and option content.
Generation context
Treating fifteen model years as one product hides the decisions that matter. Each era has a different price floor, technology baseline, and reason to buy.
2012-2017
Budget era
Median asking prices run from $10,995 to $15,995, with average mileage spanning 96,265 to 133,287 miles.
These years make sense when keeping the purchase price low matters more than having the newest driver-assistance technology. The 2015 refresh is the dividing line inside this era: Toyota changed or re-engineered nearly 2,000 parts, so 2015-2017 cars feel materially newer than 2012-2014 examples. At this age, maintenance documentation and rust or collision inspection should outweigh a one-year price difference.
Toyota: 2015 Camry redesign2018-2024
Modern gas era
Median asking prices run from $18,125 to $26,699, with average mileage spanning 45,982 to 94,019 miles.
The 2018 redesign moved the Camry to Toyota's TNGA architecture and brought new four-cylinder, V6, and hybrid powertrains. The 2021 refresh then added Toyota Safety Sense 2.5+ across the lineup. This seven-year run offers the broadest choice of prices and trims; compare adjacent years directly because a newer car can occasionally cost only a few hundred dollars more.
Toyota: all-new 2018 Camry and TNGA2025-present
Hybrid reset
Median asking prices run from $29,167 to $35,010, with average mileage spanning 1,741 to 34,435 miles.
For 2025, every Camry became a hybrid, with front-wheel drive standard and electronic all-wheel drive available. That makes raw hybrid-versus-gas depreciation comparisons misleading: most hybrid-only cars in the dataset are also the newest cars. Shop these against new-car transaction prices and warranty coverage, not against a ten-year-old gas Camry's retained percentage.
Toyota: 2025 Camry goes exclusively hybridSame-horizon comparison
We fitted the same five-year depreciation curve to the Camry and the two direct midsize-sedan peers with enough data in our catalog. Lower is better. This comparison controls the time horizon, which is more useful than averaging every model year together.
The Camry and Accord are effectively close in this snapshot, separated by only 0.8 percentage points. A clean car bought at the right price can erase that difference. The Altima gives up 16.7 points more value over five years than the Camry in our fitted curves, but that weaker resale can also make a used Altima cheaper to enter. Retention is one part of the transaction, not a reason to overpay for the Toyota badge.
Retains about 77.4% after five years
Retains about 76.6% after five years
Retains about 59.9% after five years
Curves use the same mileage-adjusted listing methodology. They do not control for purchase incentives, taxes, financing, insurance, or maintenance.
Trim strategy
Trim choice changes what you pay, but our cross-year sample does not support a clean 'best resale trim' winner. Newer Nightshade and hybrid inventory naturally shows less depreciation than older LE, XLE, and gas inventory. Use this decision framework instead.
LE
Start here if total cost matters most. Spend the saved budget on a cleaner history, better tires, or a lower-mileage example before moving up a trim for features you will not use.
SE
Choose the SE because you prefer its appearance and firmer setup, not because a generic trim chart promises better resale. On the 2022-2023 cars, compare it directly with the LE at similar mileage.
XLE / XSE
These trims can be compelling used when their original option premium has softened. Price the features you care about, then compare the actual dollar premium against an LE or SE in the same year and condition.
Hybrid / AWD
For pre-2025 cars, compare gas and hybrid examples within the same model year. For 2025 onward, every Camry is a hybrid, so the real choice is front-wheel drive versus electronic all-wheel drive and whether the used discount beats a new-car offer.
Analyst notes
A large dataset can still produce a bad conclusion when unlike cars are averaged together. These are the three interpretation rules we used for this guide.
01
Our 2026 sample shows a $35,010 median ask against a $33,325 base MSRP, with only 1,741 average miles. Those listings can include options, delivery costs, dealer pricing, or effectively new inventory. We do not interpret that spread as the car gaining value.
02
Nightshade and hybrid listings skew newer than the full LE, XLE, and gas samples. Averaging retained value across all years rewards the youngest cohort. A defensible comparison needs the same model year, similar mileage, and similar condition, which is why this guide does not crown a universal resale-winning trim.
03
NHTSA complaint and recall records are useful investigation leads, but they are not normalized for the number of vehicles sold, miles driven, or time on the road. A high count should send you to the underlying reports and VIN recall lookup; it should not become a reliability score by itself.
Estimated value of a typical Toyota Camry as it ages, from a ~$33,325 new price. We start at age two because near-new asking prices are too noisy to treat as first-year appreciation.
| Age | Retained | Est. value | Lost that year | Total lost |
|---|---|---|---|---|
| 2 yrs | 95% | $31,581 | −$1,744 | −$1,744 |
| 3 yrs | 88% | $29,419 | −$2,162 | −$3,906 |
| 4 yrs | 82% | $27,405 | −$2,014 | −$5,920 |
| 5 yrs | 77% | $25,529 | −$1,876 | −$7,796 |
| 6 yrs | 71% | $23,781 | −$1,748 | −$9,544 |
| 7 yrs | 67% | $22,152 | −$1,629 | −$11,173 |
| 8 yrs | 62% | $20,636 | −$1,516 | −$12,689 |
Interactive tool
Estimate a used Camry's value from its year and mileage, using our depreciation model.
$29,400
about typical mileage
At 36,000 miles (about typical for a 3-year-old car, ~36,000 mi). Estimate only — actual value depends on condition, trim, options, and local demand.
Cost of ownership
The two biggest costs — depreciation and fuel — over five years for a recent model bought new (~$33,325).
Fuel cost from the EPA. Maintenance, insurance, taxes, and financing are additional and vary by driver and location.
Across 3,401 Toyota Camry listings.
Accident-free
76.3%
One-owner
57.6%
Avg owners
1.5
Personal use
56.4%
Certified (CPO)
4.6%
CPO premium
+$650
Mileage profile across 3,401 listings.
Over 100k mi
24.7%
Over 150k mi
5.5%
Highest mileage
279,750 mi
Price at 120k+ mi
$12,092
Roughly 24.7% of listed Toyota Camrys have crossed 100,000 miles, and 5.5% are past 150,000. That shows there is an active market for high-mileage Camrys; it is not a survival rate or a promise that a specific car will reach either milestone.
| Year | Depreciation | MSRP | Median Price | Listings |
|---|---|---|---|---|
| 2026 | 0.8% | $33,325 | $35,010 | 102 |
| 2025 | 0.0% | $31,000 | $29,167 | 193 |
| 2024 | 3.1% | $27,960 | $26,699 | 187 |
| 2023 | 8.7% | $27,860 | $25,855 | 188 |
| 2022 | 13.5% | $27,385 | $24,016 | 167 |
| 2021 | 18.3% | $26,560 | $21,746 | 184 |
| 2020 | 27.4% | $27,570 | $20,746 | 177 |
| 2019 | 30.8% | $25,800 | $19,293 | 188 |
| 2018 | 35.2% | $25,350 | $18,125 | 182 |
| 2017 | 42.2% | $23,840 | $15,995 | 111 |
| 2016 | 48.3% | $23,840 | $13,613 | 74 |
| 2015 | 51.5% | $23,840 | $13,740 | 80 |
| 2014 | 59.9% | $27,260 | $12,695 | 71 |
| 2013 | 60.0% | $22,680 | $10,995 | 100 |
| 2012 | 60.5% | $23,220 | $11,065 | 56 |
A sample of real listings behind the figures above.
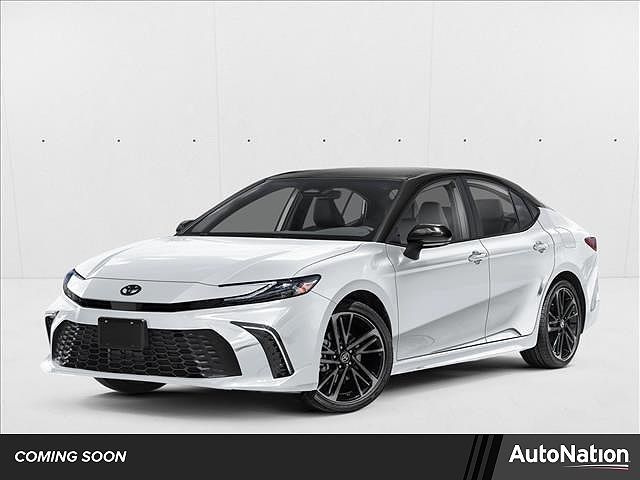
$38,152
2026 Nightshade · Wind Chill Pearl w/Midnight Black Metallic Roof
10 mi · Hayward, CA
View listing →
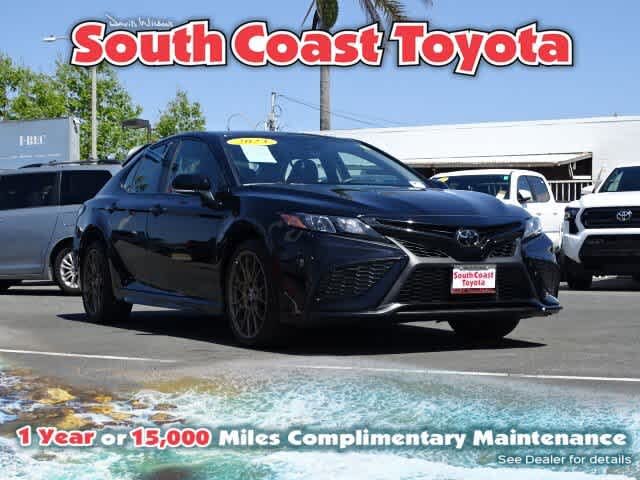
$27,687
Certified2023 SE Nightshade Edition · Midnight Black Metallic
8,962 mi · Costa Mesa, CA
View listing →
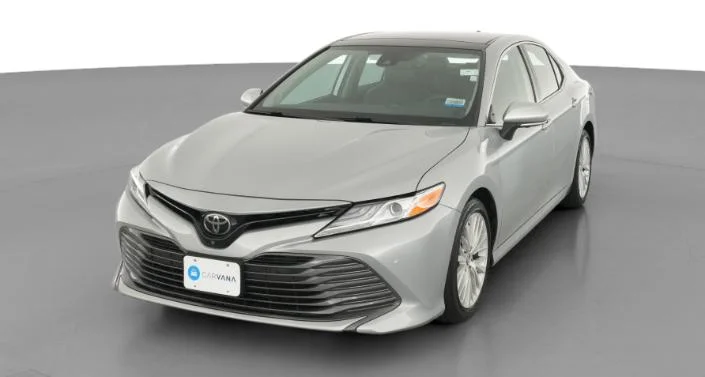
$27,990
2020 XLE · Silver
26,946 mi · Cincinnati, OH
View listing →
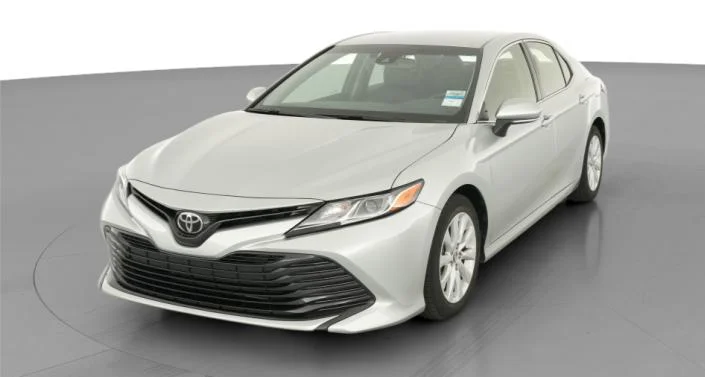
$24,990
2018 L · Silver
11,481 mi · Atlanta, GA
View listing →
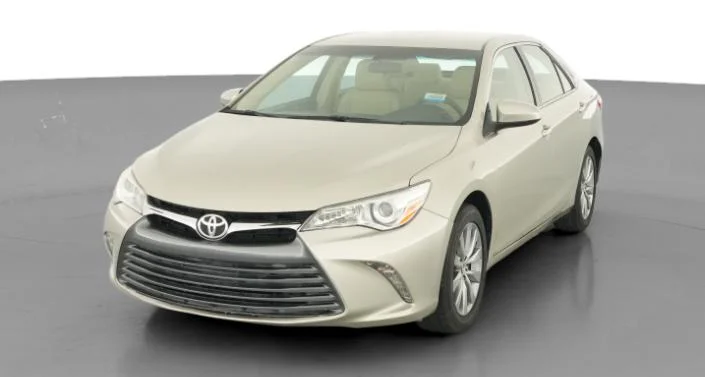
$20,990
2015 LE · Beige
29,852 mi · Birmingham, AL
View listing →
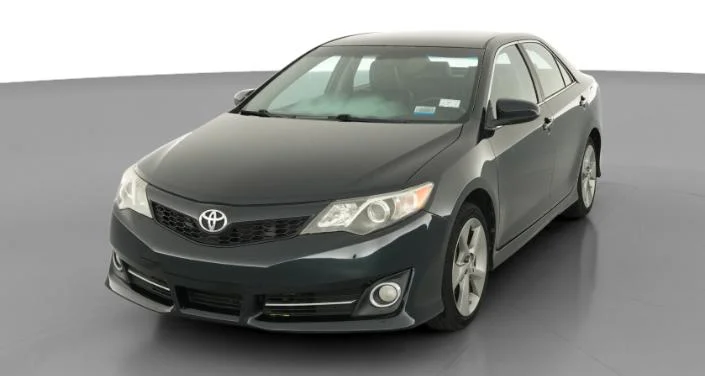
$19,990
2012 SE · Gray
16,689 mi · Atlanta, GA
View listing →
Live dealer listings, refreshed periodically. Prices and availability change.
The 2023 Camry is our best all-around pick in the current dataset. Its median asking price is $25,855, only $1,839 more than the 2022, while its average mileage is about 12,121 miles lower. It is also a late-cycle version of the 2018-2024 generation, after Toyota introduced Safety Sense 2.5+ for 2021. That does not make every 2023 better than every 2022: condition, service history, accident history, trim, and local price should decide between two specific cars. Compare at least three local examples and negotiate from the cleanest comparable car, not the national median alone.
Start with the 2015 Camry LE. The current median ask is $13,740, and 2015 received a substantial redesign to the body, cabin, and chassis. The tradeoff is mileage: the listings in our sample average 112,456 miles. At this price and age, buy the best-documented car rather than the cheapest one. Confirm maintenance history, inspect for collision repair and corrosion, scan for warning codes, and pay for an independent pre-purchase inspection. Keep part of the budget for age-related service instead of spending the full $15,000 on the purchase itself.
It can be. In this snapshot, the 2025 median ask is $29,167, only $2,468 more than the 2024 median. The 2025 begins the hybrid-only generation and offers electronic all-wheel drive, so that small observed gap favors the newer car. But near-new pricing changes quickly. Compare exact trims, equipment, mileage, warranty start dates, financing, and out-the-door totals; a discounted new 2025 or 2026 can beat an overpriced used one even when the sticker price looks higher. Verify whether a used listing was a rental, service loaner, or dealer demo before treating low age as low use.
Our unadjusted cross-year sample makes hybrids look stronger, but it does not prove the powertrain causes better resale. Hybrid listings skew newer, especially because every 2025-and-newer Camry is a hybrid, while the gas sample contains many older cars. Compare gas and hybrid cars from the same model year with similar trim, mileage, condition, and original MSRP. Then add expected fuel savings for your annual mileage. Use the EPA annual fuel-cost estimate as a common baseline, then substitute your local fuel price and driving pattern. That produces a useful ownership decision; one blended retained-value percentage does not.
24.7% of Camrys in our listing sample have more than 100,000 miles, and cars with at least 120,000 miles have a median asking price around $12,092. That shows an active high-mileage market, not a guarantee that any individual car has remaining life. A high-mileage Camry can be sensible when the service history is complete, wear items are priced into the deal, the body is structurally sound, and an independent inspection is clean. Ask the inspector to distinguish normal wear from deferred repairs and price each near-term item. Deferred maintenance can erase the purchase-price savings quickly.
Our mileage-adjusted fitted curve estimates that a Toyota Camry loses about 23.4% of its original value after five years, retaining roughly 76.6%. That is based on 3,401 listings across multiple model years, with asking prices adjusted toward an estimated sale price. It is a model-level trajectory, not a quote for a specific VIN. Your purchase price, trim, mileage, condition, accident history, location, and the new-car market at the time you sell can move the result materially. For a real purchase, calculate the dollar loss from the price you negotiate, not from an abstract national MSRP.
Use the count as a prompt to investigate, not as an automatic rejection. NHTSA complaint totals are not failure rates: older years have had more time to accumulate reports, popular years put more vehicles on the road, and one issue can generate many similar complaints. Open the model-year page, read the complaint categories, check open recalls by VIN, and ask whether documented repairs were completed. Separate a safety recall with a defined remedy from an unverified owner complaint, because they carry different evidence and next steps. The specific car's inspection and history matter more than a raw count without a sales or exposure denominator.
Depreciation is computed from 2,060 real used-car listings. Each listing's asking price is normalized to a standard 12,000 miles per year for the vehicle's age, adjusted by a 5% asking-to-sale estimate, and compared against the original base MSRP for that VIN's trim. Headline 1/3/5-year figures reflect a smoothed retention curve fitted across all model years (the typical trajectory); individual years in the table above can run above or below it with market conditions. Full methodology. Updated August 2026.