

Model comparison
Chevrolet Silverado 1500 vs Ford F-150
64% vs 68% estimated value retained after five years
See the comparisonThe Chevrolet Silverado 1500 used market combines work trucks, luxury High Country models, factory-lifted Trail Bosses, ZR2 off-road trucks, several engines, and many cab and bed combinations. Across 1,324 listings, our fitted curve estimates 36.4% depreciation after five years. Roughly 30% of this sample carries a High Country, Trail Boss, or ZR2 label, so a model-year median is only a starting point. The defensible comparison matches generation, engine, cab, bed, drivetrain, trim, and use history.
Compare With
Open a side-by-side comparison of five-year value retention, depreciation by model year, used asking prices, repair costs, MPG and safety data.
Model comparison
64% vs 68% estimated value retained after five years
See the comparison
Model comparison
64% vs 62% estimated value retained after five years
See the comparison
Model comparison
64% vs 65% estimated value retained after five years
See the comparison| Model year | Depreciation from MSRP |
|---|---|
| 2026 | 15.2% |
| 2025 | 20.9% |
| 2024 | 26.6% |
| 2023 | 27.5% |
| 2022 | 30.6% |
| 2021 | 33.5% |
| 2020 | 32.4% |
| 2019 | 42.0% |
| 2018 | 45.6% |
| 2017 | 50.7% |
| 2016 | 48.0% |
| 2015 | 53.0% |
Based on 852 real used-car listings. Each listing's price is adjusted to a standard 12,000 mi/year for its age and compared to the vehicle's original MSRP; figures reflect a 5% asking-to-sale estimate.
The buying decision
Our best all-around value pick is the 2020 Silverado 1500. It uses the fourth-generation truck introduced for 2019, yet its current median ask is $3,885 more than the 2019 sample and average mileage is about 13,597 miles lower. Near-new buyers should also price 2025 first: it costs only $1,809 more than 2024 while averaging roughly 16,646 fewer miles. Both comparisons require exact configuration matching.
Best near $30k
Target trim: LT or LTZ
Model-year sample across all trims.
The 2017 remains below the large price step into later trucks. Its median ask is $6,676 less than 2016 while average mileage is about 33,588 miles lower. LT is the practical baseline; LTZ makes sense only when its equipment and condition justify the premium.
Tradeoff: This is now an older work-capable vehicle. Inspect frame and underbody condition, drivetrain service, collision history, towing evidence, and modifications before favoring options.
Best overall value
Target trim: LT or RST
Model-year sample across all trims.
The 2020 is the strongest price anomaly in the fourth-generation data: it asks $3,885 more than 2019 and carries about 13,597 fewer average miles. LT provides a broad equipment baseline; RST should be compared only with a like-for-like engine and body configuration.
Tradeoff: The year-level median mixes engines, cabs, beds, drivetrains, and expensive trims. Confirm original equipment and MSRP before assuming every 2020 is cheaper.
Best near-new
Target trim: LT or RST
Model-year sample across all trims.
The 2025 median is just $1,809 more than 2024 while its listings average about 16,646 fewer miles. That makes 2025 the first near-new year to quote, provided engine, cab, bed, drivetrain, and trim remain comparable.
Tradeoff: Used pricing this close to newer inventory demands a complete new-truck comparison, including incentives, financing, destination, warranty start date, and dealer fees.
Generation context
The fourth-generation launch and later interior and technology update create practical shopping boundaries inside the same nameplate.
2015-2018
Third generation
Median asking prices run from $21,789 to $28,465, with average mileage spanning 80,195 to 113,783 miles.
These trucks sit below the 2019 redesign in price and now trade primarily on configuration, history, and condition. A later model year does not compensate for hard commercial use, corrosion, poor repairs, deferred service, or the wrong cab and bed. Buy the documented truck that meets the job.
Chevrolet: Silverado history and fourth-generation launch2019-2021
Early fourth generation
Median asking prices run from $26,188 to $30,689, with average mileage spanning 77,415 to 101,709 miles.
Chevrolet launched the fourth-generation Silverado for 2019 with expanded trim and powertrain choice, including Trail Boss variants and an available light-duty diesel. The 2020 price inversion is the key value signal in this band, but configuration matching is mandatory.
Chevrolet: Silverado history and fourth-generation launch2022-present
Updated fourth generation
Median asking prices run from $43,950 to $55,287, with average mileage spanning 288 to 37,157 miles.
Silverado 1500 received major interior and technology upgrades for the 2022 model year, and ZR2 joined the top of the off-road range. Equipment can differ within the transition, especially by trim and production timing. Verify the actual screen, cabin, safety, engine, and option content by VIN.
GM: 2019 truck launch and 2022 Silverado technology updateSame-horizon comparison
These five-year fitted curves use a common methodology, but nameplate-level truck comparisons cannot normalize the enormous range of engines, bodies, equipment, and original prices.
The Silverado sits between its two core rivals in our curves. It loses 4.0 percentage points more than the F-150 and 1.6 points less than the Ram 1500. That result is useful for broad resale planning, not for paying a premium. A correctly configured truck at a lower purchase price can still produce the better ownership outcome.
Retains about 67.5% after five years
Retains about 63.6% after five years
Retains about 61.9% after five years
Curves do not normalize engine, cab, bed, axle ratio, fleet use, towing equipment, incentives, financing, fuel, insurance, or maintenance.
Truck-first strategy
Choose capability and body configuration before trim. A luxury or off-road badge cannot fix the wrong payload, bed, or towing setup.
Work Truck / LT
Confirm regular, double, or crew cab; bed length; drivetrain; axle ratio; payload label; and trailering equipment. Add convenience features only after the truck meets the actual workload.
RST / LTZ
These trims can combine daily comfort with useful equipment, but packages vary. Compare window stickers and the real used-price gap rather than treating two similar-looking trucks as identical.
Duramax diesel
Verify the exact diesel engine, emissions-system history, fuel and maintenance needs, towing profile, and remaining coverage. Compare with a same-year gas truck instead of using a mixed-year resale average.
Trail Boss / ZR2
Factory lifts, tires, suspension, lockers, and prior terrain use change both price and inspection needs. Compare like with like and inspect the underbody and modifications carefully.
Before you commit
The VIN and door labels determine what the truck is. The inspection and records determine how it has been treated.
Use the VIN, original window sticker, and build information. Listing titles routinely omit trailering, axle, safety, interior, and appearance packages that move capability and price.
Payload falls as options and passengers add weight. Read the yellow door-jamb label and calculate people, cargo, hitch weight, and accessories instead of relying on a maximum advertisement.
Review hitch, bed, frame, underbody, suspension, tires, leaks, modifications, and corrosion. Compare physical evidence with the seller's account and service documentation.
Use NHTSA or Chevrolet's VIN lookup for applicability and remedy status. Model-year totals cannot tell you whether the specific truck is included or repaired.
Analyst notes
Several counterintuitive year results are useful clues, but none should be interpreted without configuration and mileage context.
01
The 2024 sample asks $11,337 less than 2023, but it also averages about 937 more miles. Trim and prior-use mix can create the inversion; it is not proof that a comparable 2024 is cheaper.
02
About 29.8% of the sample is labeled High Country, Trail Boss, or ZR2. Those trucks carry different equipment, original prices, and use patterns from an ordinary LT or Work Truck.
03
The interior and technology transition varies by trim and production timing. Verify the exact equipment from photos, VIN records, and the original sticker before paying an updated-model premium.
Estimated value of a typical Chevrolet Silverado 1500 as it ages, from a ~$54,700 new price. We start at age two because near-new asking prices are too noisy to treat as first-year appreciation.
| Age | Retained | Est. value | Lost that year | Total lost |
|---|---|---|---|---|
| 2 yrs | 75% | $41,068 | −$2,345 | −$13,632 |
| 3 yrs | 71% | $38,850 | −$2,218 | −$15,850 |
| 4 yrs | 67% | $36,751 | −$2,099 | −$17,949 |
| 5 yrs | 64% | $34,766 | −$1,985 | −$19,934 |
| 6 yrs | 60% | $32,888 | −$1,878 | −$21,812 |
| 7 yrs | 57% | $31,112 | −$1,776 | −$23,588 |
| 8 yrs | 54% | $29,431 | −$1,681 | −$25,269 |
Interactive tool
Estimate a used Silverado 1500's value from its year and mileage, using our depreciation model.
$32,900
about typical mileage
At 72,000 miles (about typical for a 6-year-old car, ~72,000 mi). Estimate only — actual value depends on condition, trim, options, and local demand.
Cost of ownership
The two biggest costs — depreciation and fuel — over five years for a recent model bought new (~$54,700).
Fuel cost from the EPA. Maintenance, insurance, taxes, and financing are additional and vary by driver and location.
Across 1,324 Chevrolet Silverado 1500 listings.
Accident-free
85.7%
One-owner
53.3%
Avg owners
1.5
Personal use
70.7%
Certified (CPO)
4.5%
CPO premium
+$2,250
Mileage profile across 1,324 listings.
Over 100k mi
14.4%
Over 150k mi
2.5%
Highest mileage
198,265 mi
Price at 120k+ mi
$22,269
Roughly 14.4% of listed Chevrolet Silverado 1500s have crossed 100,000 miles, and 2.5% are past 150,000. That shows there is an active market for high-mileage Silverado 1500s; it is not a survival rate or a promise that a specific car will reach either milestone.
| Year | Depreciation | MSRP | Median Price | Listings |
|---|---|---|---|---|
| 2026 | 15.2% | $54,700 | $49,294 | 169 |
| 2025 | 20.9% | $53,800 | $45,759 | 48 |
| 2024 | 26.6% | $54,700 | $43,950 | 69 |
| 2023 | 27.5% | $71,500 | $55,287 | 60 |
| 2022 | 30.6% | $58,150 | $47,110 | 60 |
| 2021 | 33.5% | $46,150 | $30,689 | 103 |
| 2020 | 32.4% | $44,500 | $30,073 | 63 |
| 2019 | 42.0% | $44,500 | $26,188 | 62 |
| 2018 | 45.6% | $43,205 | $25,150 | 45 |
| 2017 | 50.7% | $42,555 | $21,789 | 53 |
| 2016 | 48.0% | $43,775 | $28,465 | 60 |
| 2015 | 53.0% | $42,010 | $23,995 | 60 |
A sample of real listings behind the figures above.
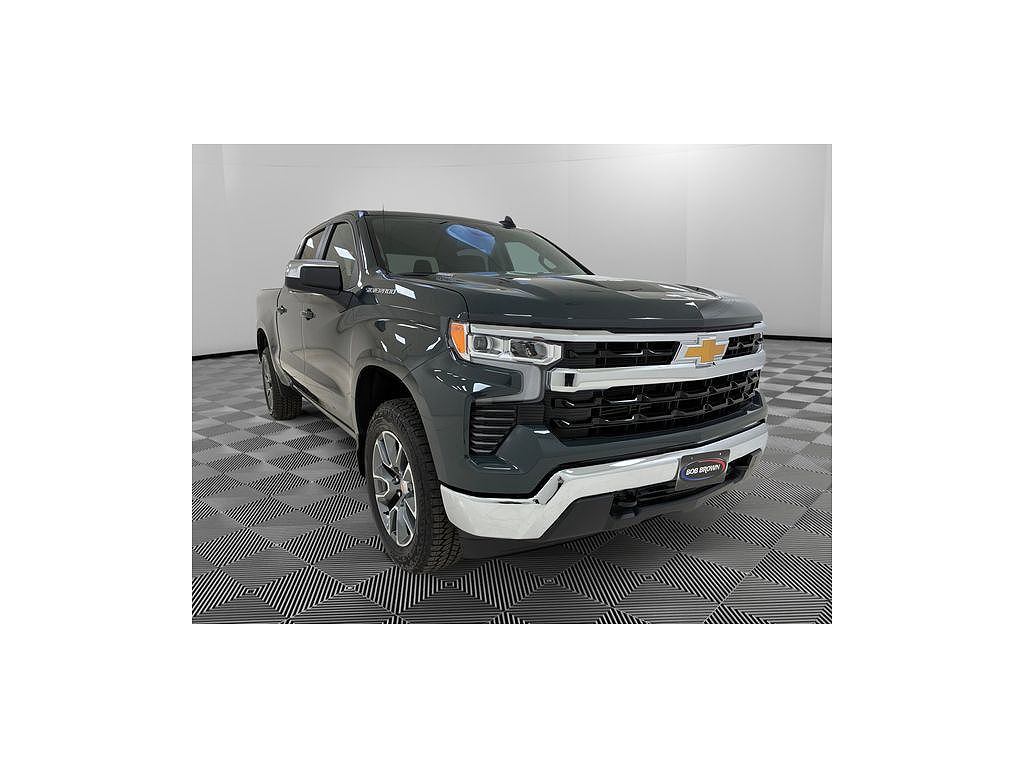
$50,646
Certified2026 LT Fleet · Cypress Gray
5 mi · Urbandale, IA
View listing →

$53,536
2024 RST · Summit White
4,237 mi · Sugar Land, TX
View listing →
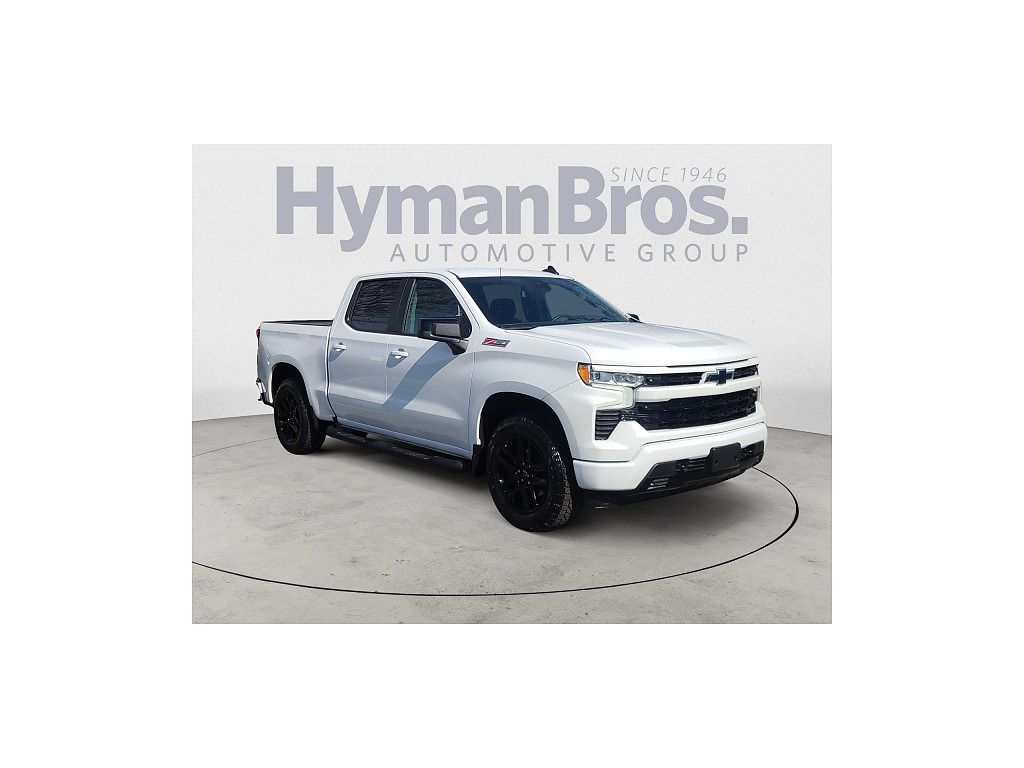
$48,995
2022 RST · Summit White
4,506 mi · Richmond, VA
View listing →

$47,862
2019 RST · Black
19,363 mi · Farmville, VA
View listing →

$35,408
2017 LT · Silver Ice Metallic
21,433 mi · Paxton, IL
View listing →

$30,575
2015 LT · Deep Ocean Blue Metallic
16,623 mi · Egg Harbor Township, NJ
View listing →
Live dealer listings, refreshed periodically. Prices and availability change.
The 2020 Silverado 1500 is our best all-around value pick. It belongs to the fourth generation introduced for 2019, yet its all-trim median ask is $3,885 more than the 2019 and average mileage is about 13,597 miles lower. That is a strong search signal, not a universal verdict. Match engine, cab, bed, drivetrain, axle, trim, packages, mileage, and prior use. A well-documented 2019 or cleaner 2021 can still be the better truck after inspection and negotiation.
Start with a 2017 LT or LTZ. Its current median ask is about $21,789, with average mileage near 113,783. LT provides the practical equipment baseline; LTZ can make sense when its comfort features and condition justify the premium. At this age, prioritize service records, frame and underbody condition, drivetrain behavior, tires, brakes, collision repair, modifications, and evidence of towing or commercial use.
The current data says 2020 deserves the first look. Its median ask is $3,885 more than 2019 and its sample averages about 13,597 fewer miles. Both use the fourth-generation architecture, making this more useful than a cross-generation comparison. The average still mixes body styles, engines, drivetrains, and trims. Match the complete configuration and original equipment, then let maintenance, inspection, capability, and out-the-door price choose the specific truck.
Price 2025 first. Its current median ask is only $1,809 more than 2024 while average mileage is about 16,646 miles lower. That combination favors the newer year, but trim and configuration mix can distort both medians. Compare the same engine, cab, bed, drivetrain, and trim, then include dealer fees, incentives, financing, warranty start date, and any new-truck alternative. A heavily discounted or better-equipped 2024 can still deliver the stronger complete transaction.
The blended dataset cannot establish that fairly. Diesel listings differ in model year, trim, original price, towing use, mileage, and maintenance from the gas inventory. Compare same-year trucks with the same cab, bed, drivetrain, equipment, condition, and similar original MSRP. Then include fuel prices, expected annual mileage, emissions-system service, towing needs, maintenance, and purchase premium. A powertrain can be the right ownership choice without being a universal resale winner, and the specific truck's history remains more important than a mixed average.
Start by proving that the trucks perform the same job. Record model year, engine, transmission, cab, bed, drivetrain, axle ratio, door-jamb payload, trailering equipment, trim, packages, mileage, use history, accident history, tires, and modifications. Retrieve the original window sticker or build data because an LT, RST, LTZ, High Country, Trail Boss, or ZR2 badge does not reveal every capability option. Keep diesel, gas, conventional, and off-road configurations in separate comparison sets. Inspect the hitch, bed, frame, underbody, suspension, cooling system, leaks, body repair, corrosion, and tire wear, then estimate immediate work in dollars. Compare asking price only after those differences are visible. Add taxes, dealer products, financing, warranty timing, and any new-truck incentive to reach an out-the-door figure. A truck that is advertised for less but lacks the required payload, cab, bed, or towing hardware is not the lower-cost choice once replacement or compromise enters the calculation. When a seller cannot document the build or explain modifications, price the uncertainty as risk and keep an equivalent unmodified truck in the comparison. Insurance quotes can also differ by trim, engine, and use, so obtain them before treating two monthly payments as equivalent.
14.4% of Silverado 1500 listings in this dataset exceed 100,000 miles, while trucks at 120,000 miles or more have a median ask around $22,269. That describes current inventory, not the probability of reaching a mileage target. A high-mileage truck can make sense with complete records, a clean frame and structural inspection, and enough discount for near-term work. Inspect drivetrain behavior, cooling, leaks, tires, suspension, brakes, towing wear, modifications, and corrosion.
Our mileage-adjusted fitted curve estimates about 36.4% depreciation after five years, leaving roughly 63.6% of original value. The estimate uses 1,324 current listings and a common asking-to-sale adjustment. It is a nameplate-level path, not a VIN appraisal. Engine, cab, bed, drivetrain, axle, packages, trim, original price, mileage, condition, prior use, and local truck demand can all move the result. Estimate dollar loss from the exact configuration and price you negotiate.
Depreciation is computed from 852 real used-car listings. Each listing's asking price is normalized to a standard 12,000 miles per year for the vehicle's age, adjusted by a 5% asking-to-sale estimate, and compared against the original base MSRP for that VIN's trim. Headline 1/3/5-year figures reflect a smoothed retention curve fitted across all model years (the typical trajectory); individual years in the table above can run above or below it with market conditions. Full methodology. Updated August 2026.